Digital Beekeeping
Hive Scale Data in Beekeeping
What You Can Really Learn from It
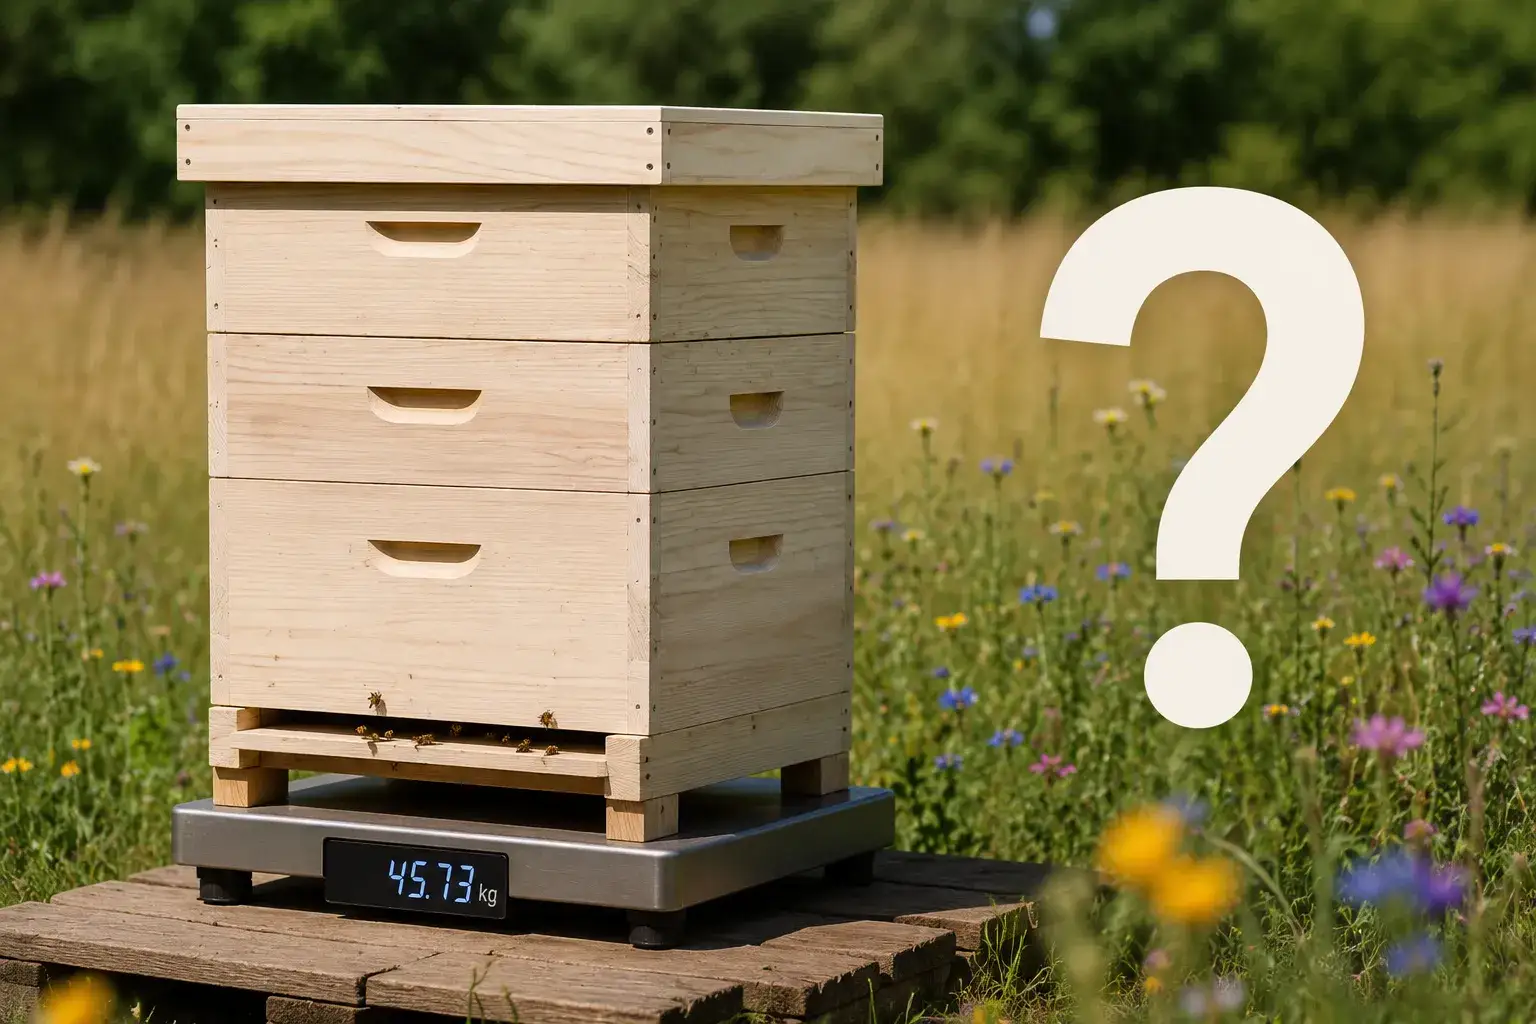
A hive scale is often initially viewed as a simple “honey counter.” When the hive gains weight, nectar is coming in. When it loses weight, it’s being consumed. However, it’s not so simple in practice.
A hive scale never measures just honey. It indirectly measures the interaction between the colony, weather, vegetation, season, and nectar flow. This is why the data is so interesting. It’s not the individual measurement that matters but the development over days, weeks, and months.
Only by considering weight data alongside weather data and the growing degree days, can one truly understand why a colony develops as it does.
What a Hive Scale Actually Measures
The scale initially measures only the total weight of the hive. This weight is composed of many components: bee mass, brood, food stores, fresh nectar, partially dried nectar, honey, pollen, hive parts, and supers.
Therefore, the absolute weight alone is often not very meaningful. Much more important is the change. If a colony increases over several days, this initially means only: More is coming in than is being used.
The real intriguing question is: Why is this happening? Behind a weight gain is often a whole chain of biological and weather-dependent processes.
- Which plants are currently blooming?
- Are these plants producing nectar at all?
- Was the temperature high enough?
- Was the night too cold?
- Was there enough ground moisture?
- Could the bees fly well?
- Is the colony strong enough?
- Was there enough space in the super?
- Is the colony already in swarming mood?
The scale does not show the cause itself but the result of many individual factors. This is where its great value lies.
Why Weather Alone Is Often Not Enough
Many beekeepers first look to the weather: “Today was good flying weather, so a lot should have been brought in.” In practice, however, it often doesn’t work that simply.
Plants do not only react to the current weather but to their overall developmental stage. This is where growing degree days become interesting.
Growing degree days describe how biologically developed the vegetation is in the year. This helps to understand why some years progress significantly earlier or later, even if the calendar date is the same.
- Fruit blossoms may begin earlier.
- Rapeseed may provide earlier.
- Colonies can grow faster.
- Swarming mood can arise earlier.
- Nectar flow peaks can occur much earlier.
The scale often shows this development very clearly: sudden strong daily gains, even though the calendar date appears to be “early.”
Properly Assessing the Start of Nectar Flow
A bloom alone does not mean nectar flow. Many plants visibly bloom but provide little usable nectar. The scale helps to make this difference visible.
Typically, the picture is as follows: The plants are in full bloom, many bees are flying, yet the weight hardly increases. The cause often does not lie with the colony itself but with plant conditions.
- cold nights
- drought
- lack of ground moisture
- low morning temperatures
- unfavorable humidity
- wind
- decreasing nectar production
The plants may appear to bloom strongly, but biologically, the nectar flow may already be weakening. This is precisely why weight data, together with weather and growing degree days, is so valuable.
Why Strong Colonies Sometimes Produce Little Honey
Large colonies always appear capable at first glance. Lots of brood, many bees, and strong flight activity look impressive. Yet a large colony does not automatically produce much honey.
A strong colony itself consumes a lot of energy. Brood needs warming, many nurse bees must be cared for, protein demand increases, and metabolism runs at a high level.
If at the same time the nectar flow weakens, rain sets in, cold nights occur, or wind reduces flight, a large colony can even lose weight faster than a smaller one.
The scale thereby shows something very important: Biological strength and economic performance are not automatically the same.
Early Detection of Nectar Flow Gaps
A nectar flow gap is often recognized earlier on the scale than at the entrance. The bees often continue to fly intensively but no longer find sufficient usable nectar. Then the weights hardly rise or even slowly fall.
Not every nectar flow gap has the same cause. Sometimes rain only temporarily prevents nectar intake. Sometimes cold nights reduce nectar secretion. Drought, wind, or already advanced vegetation can also play a role.
This helps to understand why nectar flow sometimes “suddenly” ends, even though the plants are still present externally.
Better Understanding Super Management
Hive scales not only help to see if nectar flow is present. They also help to better assess the dynamics of a nectar flow.
If strong increases occur over several consecutive days and at the same time the temperatures rise, the growing degree days increase rapidly, and stable weather is forecasted, a strong nectar flow phase is often building up.
This allows for earlier identification of when additional space is needed. This becomes particularly important from the second super onwards. Then there is usually enough bee volume, and lack of space becomes often more dangerous than too much.
Better Assessing Swarm Mood
Swarm mood rarely arises suddenly without context. Often several developments co-occur: high growing degree days, strong colony development, large brood areas, high pollen intake, good nectar flow conditions, long days, and stable weather.
The scale then often initially shows strong daily increases. This explosive development can already be an indication that developmental pressure in the colony is increasing.
If lack of space is added, the likelihood of swarming mood increases significantly. The scale thereby helps not only in recognizing a possible swarm leaving but often beforehand in understanding the overall development.
Recognizing Swarm Exits
When a swarm leaves, the scale often shows a sudden weight loss. But one should not think too simply here either. Not every weight loss automatically means a swarm.
- beekeeper interventions
- removed supers
- rainwater loss
- measurement error
- shifted hive parts, stones, covers
- branches or leaves on the hive blown off by wind
- etc.
Therefore, multiple pieces of information are always important: season, weather, colony development, prior swarm mood, time of day of the weight loss, and flight behavior. Only from the context does a reliable picture emerge.
Properly Understanding Winter Consumption
In winter, the scale mainly shows the consumption of stores. Interesting is: Cold winters do not automatically lead to high consumption. Often variable warm winters are more problematic.
Warmth can trigger earlier brood activity. This increases heat demand, metabolism, food consumption, and colony activity. Especially with an early rise in growing degree days, some colonies begin to brood intensively very early.
The scale then sometimes shows surprisingly high losses, even though it still looks like winter outside. This helps to understand why some colonies become critical in spring despite seemingly good feeding.
Comparing Locations Better
Over several years, hive scales become a true tool for site analysis. One recognizes when certain nectar flows reliably begin, how strong individual flows are, and how sensitive locations are to drought.
This becomes particularly valuable together with weather data and growing degree day trends. It allows much better comparison of years and understanding why some years went exceptionally well or poorly.
What Additional Sensors Can Do
A simple hive scale mainly shows how the colony behaves outwardly. Additional sensors for temperature and humidity, in contrast, enable a much deeper insight into the colony’s internal processes.
This way, it’s not just visible that something is changing, but often how the colony is currently working and reacting.
- Weight data
- Weather data
- Growing degree days
- Internal temperature
- Humidity in the colony
Many biological processes in the bee colony are directly related to heat and moisture regulation.
Understanding Temperature Data Correctly
A bee colony actively generates heat. Especially the brood nest is maintained at a very consistent temperature. Therefore, temperature sensors can provide interesting insights into the colony’s internal state.
Not individual temperature values are crucial, but their course and stability. A strong colony with healthy brood usually keeps the brood nest consistently warm. Changes often occur when something biologically changes in the colony.
- Start of stronger brood activity
- Brood interruptions
- Swarm departure
- Loss of the queen
- Weak colony development
- Issues with heat regulation
- Strong outside temperature influences
- Changes in the bee cluster position in winter
Recognizing Early Brood Development
Temperature development becomes particularly exciting in late winter and spring. Many colonies begin very early with intensive brooding again. From the outside, this is often scarcely visible. Temperature data often show this development much earlier.
The colony then significantly stabilizes and maintains its heat budget in the brood area. This allows better understanding of why more food is suddenly consumed, why the scale drops faster, and why some colonies grow earlier.
In connection with growing degree days, it often becomes visible: Vegetation develops early, the colony reacts biologically early, brood activity increases, consumption rises, and the scale drops more significantly.
Temperature Behavior During Swarm Mood
Temperature data can also become interesting during swarm mood. Shortly before swarming, the entire colony dynamics often change: very high bee mass, strong heat production, high activity, altered air circulation, and restructuring of internal organization.
After a swarm departure, the temperature management often changes significantly because suddenly many bees are missing. Temperature data alone do not prove a swarm. Together with weight data and weather, however, often a very clear picture emerges.
Understanding Humidity in the Colony
Humidity is often underestimated. Yet it says surprisingly much about the internal processes in the colony. Bees actively regulate not only temperature but also moisture.
This is closely linked to nectar intake, honey thickening, brood care, water transport, ventilation, outside temperature, and colony strength.
Fresh nectar contains a lot of water. This water needs to be evaporated by the bees to create storable honey. During strong nectar flow, the moisture burden in the colony often rises significantly.
- High intake means higher evaporation performance.
- High outside temperatures often lead to stronger ventilation.
- High outside humidity makes thickening difficult.
- Strong colonies often regulate more stably than weaker ones.
The Relationship Between Weather and Hive Climate
Particularly interesting is the combination of internal and external data. When outside humidity is high and there is little wind while the scale shows good intake and humidity in the colony rises at the same time, an important connection becomes visible.
The colony brings in a lot of fresh nectar but simultaneously has a high workload in drying the honey. This helps to better understand why some nectar flow phases “mature” slower despite good intake.
Conversely, dry warm air masses can significantly accelerate the thickening process. Sensors not only show honey intake but indirectly also the processing of nectar.
Temperature and Humidity in Winter
Even in winter, such sensors provide interesting information. They show how stable the colony keeps its winter cluster, how strongly it reacts to outside temperatures, and whether brood activity begins early.
- How stable is the winter cluster maintained?
- Does the colony react strongly to outside temperatures?
- Does brood activity start early?
- Is there unusually high humidity?
- Is there a risk of condensation?
- Does the position of the winter cluster change?
If the consumption suddenly increases sharply and at the same time the stability of the brood temperature rises, there is much to suggest that intensive brooding has begun.
Why Individual Sensor Readings Are Often Misinterpreted
A common mistake is to consider individual sensor readings in isolation. For example, saying “The humidity is high” alone means almost nothing.
The real question is: Why is it high? Possible reasons are strong nectar intake, weather conditions, poor ventilation, high external humidity, a large colony, much open brood, water transport, or low flight activity.
Only together with weather, weight, temperature, season, growing degree days, and colony development do such data become truly meaningful.
Predictions with Linked Data
With enough data, amazingly good forecasts can be made. The longer data is collected, the better such models become. Over time, a sort of biological memory of the location emerges.
- when a super is likely to be filled
- when food could become critical
- when typical nectar flow phases begin
- which weather conditions bring strong intake
- when nectar flow gaps are likely
- which colonies work particularly efficiently
- when brood activity significantly increases
- when swarm pressure rises
- how strongly weather changes affect the colony
What Sensors Cannot Replace
Despite all possibilities, it remains important: Sensors do not replace inspections. They can make many developments visible but cannot securely detect everything. They provide hints, not absolute truths.
- what the brood pattern looks like
- whether queen cells are present
- the actual level of Varroa infestation
- whether diseases are present
- how gentle a colony is
- and much more…
But they greatly assist in recognizing developments earlier and conducting inspections more targeted.
The True Strength of Modern Data Analysis
The greatest benefit today no longer comes from individual sensors but from the linking of many pieces of information. Only when hive scales, weather data, growing degree days, temperature, humidity, colony development, inspections, Varroa data, nectar flow courses, queen information, and location data are considered together, does a truly understandable overall picture emerge.
Then one doesn’t just see: “The colony gained 2 kg today.” Rather, one understands much better why this development is taking place, how stable the colony is working, how strong the brood activity is, how intensively nectar is being processed, and how sensitively the colony reacts to weather.
And this is precisely where the future of modern beekeeping lies: not only collecting data but better understanding biological connections over the entire course of the year.
Modern digital systems can today directly connect and jointly evaluate such sensors. Only when weight data, weather, growing degree days, temperature, humidity, and the rest of a colony’s hive data are integrated, do the truly interesting connections often emerge that would barely be visible when considering individual values in isolation.
Conclusion
Hive scale data is far more than just simple weight values. When properly interpreted, they show how a colony reacts to weather, nectar flow, vegetation, brood development, and location conditions.
Their greatest value does not come from a single number but from the context. Those who consider weight, weather, growing degree days, temperature, humidity, and observations of the colony together recognize developments earlier and make better decisions at the apiary.
Our beekeeper app already offers an interface to connect hive scales and sensors and can automatically evaluate their data to make developments and connections much more visible.
Try bee-pilot.io now