What Can a Hive Scale Really Tell Us About a Bee Colony?
At first glance, the answer is simple: it tells us how much the colony weighs.
But that’s not the most interesting information. What’s more intriguing is: what has changed?
Has the colony gained weight today? When did the weight start increasing? Are the other colonies at the site developing in the same way? Does the change match the weather? Is a nectar flow starting? Or is one colony falling behind its neighbors?
This is where the real interesting use of a digital hive scale begins for us.
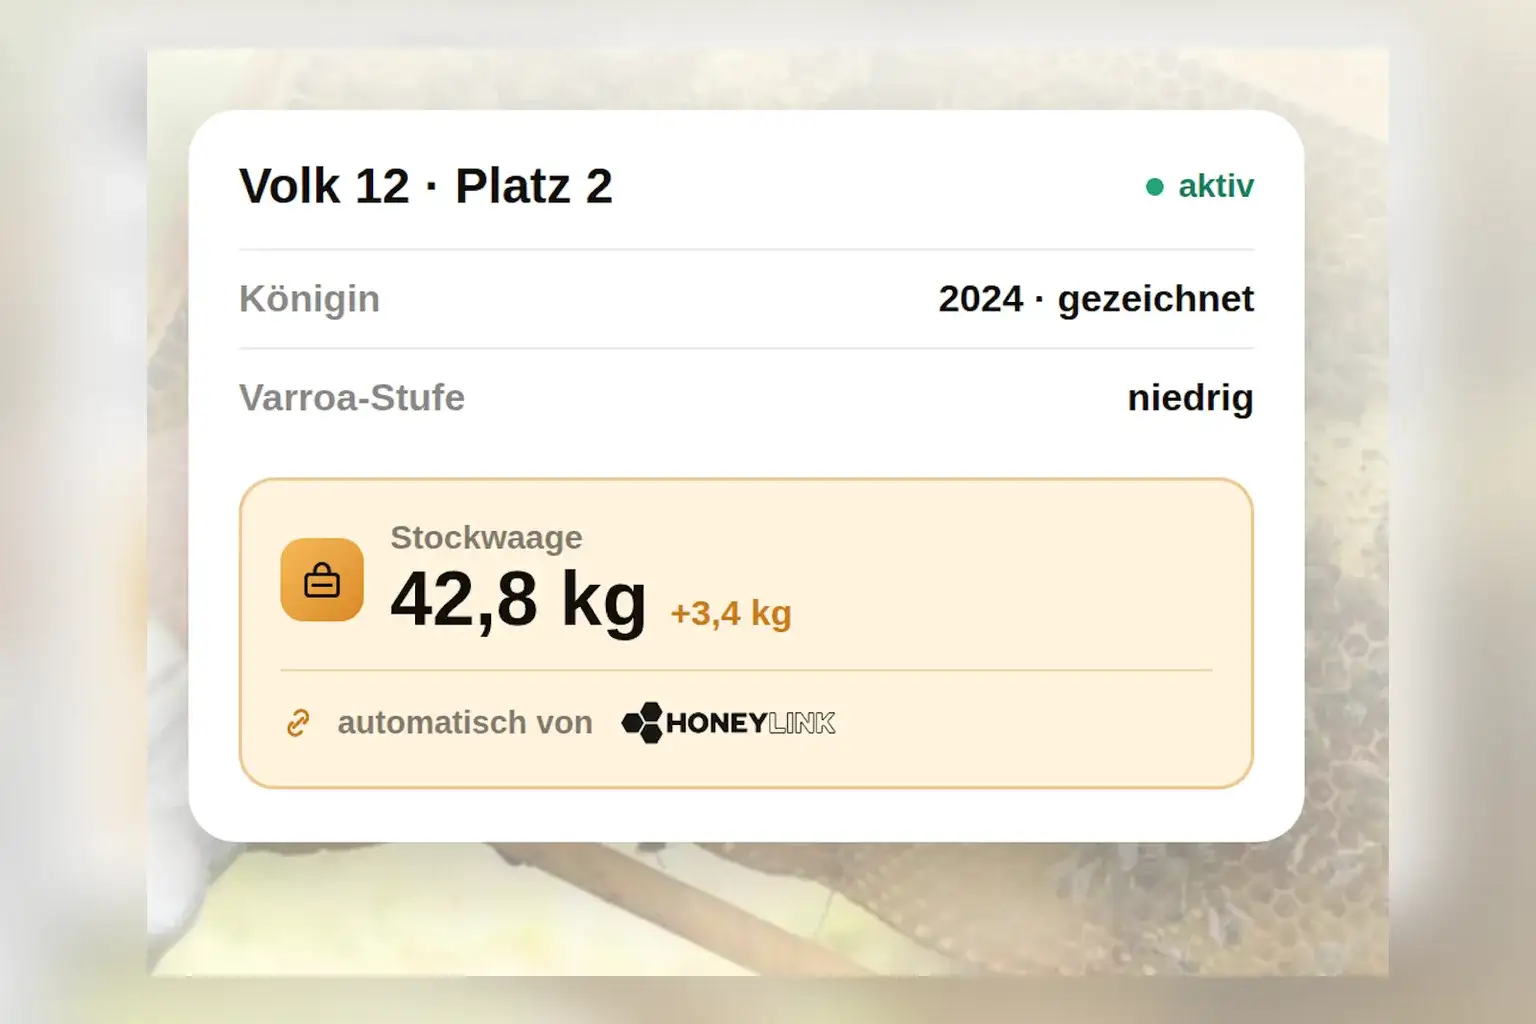
Through the collaboration of Honeylink and bee-pilot, we connect the continuous measurement data from the hive scales with the information that bee-pilot already knows about the colony, the bee yard, and the environment.
The result is meant to be something far more valuable from a weight curve: a comprehensible decision aid for the beekeeper.
A Single Number Alone Tells No Story
Imagine a typical evening during bee season. The hive scale reads: +2.4 kg.
At first, that sounds good. But what do we really know? Not much.
Only when we look at the past few days does a context emerge:
| Day | Weight Change |
|---|---|
| Monday | +0.2 kg |
| Tuesday | +0.8 kg |
| Wednesday | +1.5 kg |
| Thursday | +2.4 kg |
We already see a trend: the intake is increasing. But bee-pilot can add more information.
Several other colonies equipped with Honeylink scales at the same site show an increasing weight trend. At the same time, temperatures are rising and flying conditions are favorable. The GTS and flow area of bee-pilot also provide information about the current development of relevant nectar plants.
Weight + Trend + Comparison Colonies + Weather + Nectar Flow Development
The nectar intake is significantly increasing. Several colonies at the site have shown a similar trend for several days.
The hive scale measures. bee-pilot puts the measurement in context.
Why Honeylink and bee-pilot Fit Well Together
Honeylink provides continuous measurement right at the bee colony with its digital hive scales.
The BeeScale operates wirelessly and can weigh hives up to 200 kg. Multiple scales can be connected via a BeeBase. A BeeBase connects up to 64 scales over LTE and is powered by solar energy.
The ability to capture multiple colonies at a site is particularly interesting for bee-pilot.
A single colony can tell us a lot. However, multiple colonies tell us what’s happening across the entire location.
The Best Comparison Is Often Right Next Door
Let’s take five colonies at the same bee yard. After three good nectar flow days, the development looks like this:
| Colony | Weight Change |
|---|---|
| Colony 1 | +7.8 kg |
| Colony 2 | +7.1 kg |
| Colony 3 | +1.3 kg |
| Colony 4 | +7.6 kg |
| Colony 5 | +8.0 kg |
Looking at Colony 3 alone, a +1.3 kg gain initially doesn’t seem very noticeable. But four other colonies gained between seven and eight kilograms under almost the same conditions. Suddenly, the value takes on a completely different meaning.
Another layer comes in: bee-pilot knows the inspection data. For Colony 3, a lower colony strength was documented during the last inspection.
lower weight gain + significantly stronger comparison colonies + same location + same weather conditions + lower colony strength in the last inspection
This colony is utilizing the current nectar flow much less than comparable colonies at the site. A lower colony strength was also documented during the last inspection. A check may be useful.
The beekeeper decides. But now he knows where a closer look is worthwhile.
Is a Nectar Flow Starting?
The beginning of a nectar flow can’t be determined from a single measurement.
| Day | Weight Change |
|---|---|
| Day 1 | +0.1 kg |
| Day 2 | +0.5 kg |
| Day 3 | +1.3 kg |
| Day 4 | +2.6 kg |
| Day 5 | +3.7 kg |
A clear pattern emerges. Now we look at the other colonies: their daily intake is also rising. Temperatures are increasing, and flying conditions are improving. Additionally, the GTS and phenology module show that relevant nectar plants are entering the corresponding development phase.
Significantly increasing nectar intake at the site. Several colonies have been showing a rising trend for five days.
It’s not a single number that determines. The pattern determines.
Is the Nectar Flow Over – or Is It Just Raining?
For a week, colonies bring in two to four kilograms of weight gain daily. Then suddenly: +0.1 kg.
Is the nectar flow over? Looking only at this value, one might think so. But it rained for most of the day, the temperature dropped, flying opportunities were highly restricted, and all scale colonies at the site show the same drop.
Nectar intake is sharply reduced today. At the same time, flying conditions were restricted due to weather. The comparison colonies show the same trend. A nectar flow end cannot currently be inferred from this.
On the next sunny day, the colonies gain significantly again. This confirms the assessment: it was very likely a weather-related interruption.
And What If the Weather Stays Good?
Now we change the example. The weather remains excellent. Yet the intake develops as follows:
| Day | Weight Change |
|---|---|
| Day 1 | +3.4 kg |
| Day 2 | +2.5 kg |
| Day 3 | +1.6 kg |
| Day 4 | +0.8 kg |
| Day 5 | +0.3 kg |
Several colonies show the same continuous decline, despite good flying conditions.
Nectar intake has been significantly decreasing for several days. Given continued good flying conditions and several colonies at the site showing the same trend, the development suggests a possible nectar flow end.
No single sensor directly measured the nectar flow end. But multiple pieces of information point in the same direction.
Weather Becomes Part of the Weight Curve
A daily value of +0.3 kg with twelve hours of rain means something entirely different than +0.3 kg with optimal flying weather.
That’s why weather and weight in bee-pilot should not be viewed independently.
Today’s nectar intake is significantly below the 7-day average. Meanwhile, flying conditions were severely restricted.
Such assessments prevent incorrect conclusions.
What’s Currently Blooming?
Here’s another component of bee-pilot: GTS, phenology, and nectar flow observation.
The hive scale can show: something is starting now. The phenological information can show: what could be timely?
If weights of several colonies increase sharply at the same time and at the same time the bloom of a relevant nectar plant begins in the region, an interesting connection arises.
However, the hive scale cannot determine which plant is actually being visited. Therefore, it should not say: “The bees are currently bringing in black locust nectar.”
The increasing nectar intake coincides with the start of relevant nectar plants in the vicinity.
This is more cautious – and technically sound.
Daily Changes Tell a Second Story
Not just the day-to-day change is interesting. Within a day, a hive scale shows a lot.
In the morning, thousands of foraging bees leave the colony. Throughout the day, they return. Nectar, pollen, and water are brought in. At the same time, water is released from the collected nectar.
That’s why a weight gain of, say, three kilograms cannot simply be equated with three kilograms of produced honey.
More interesting are questions like: When does the weight gain start? When is the peak intake? When does it end? Does this pattern repeat the next day?
Over several days, such a daily profile of the colony and the site can emerge.
A Sudden Weight Loss – Is It a Swarm?
A colony loses a significant amount of weight in a short time. This could fit a swarm. But weight loss alone isn’t enough for this claim.
Now bee-pilot considers other information: The loss occurs within a short timeframe, weather conditions allow strong bee flights, the weight stabilizes significantly below the previous level, and a swarm mood was documented at the last inspection.
sudden weight loss + suitable flying conditions + permanently lower weight + documented swarm mood
Notable rapid weight loss detected. Together with the last documented swarm mood, there is an increased suspicion of a swarm event. Inspection recommended.
There’s a reason it says suspicion and not “swarm detected.” The system should not pretend certainty from data it cannot provide.
In Winter, the Question Changes
During the nectar flow, we’re mainly interested in weight gain. In winter, the other direction becomes important: How fast does the colony lose weight?
A single loss of 100 grams tells little. Over several weeks a consumption curve emerges.
If a colony’s weight loss suddenly increases significantly while the neighboring scale colonies do not show this development and the outside temperature does not sufficiently explain the deviation, a hint emerges.
The weight loss of this colony is significantly above its previous trend and above the comparison colonies at the site. Observe food development.
Even More Interesting: How Long Will the Supply Last?
With sufficient historical data, you can not only ask how much weight a colony loses, but how the supply will develop at this rate.
From current weight, documented hive weight, and past consumption, a trend can be estimated. A forecast must always be recognized as a forecast since future consumption can change due to temperature and brood development.
If the current consumption trend continues, the documented minimum supply will likely be reached in about 18 days.
The beekeeper receives information not only when a critical value is reached but can react beforehand.
What About the Entire Bee Yard?
Honeylink and bee-pilot enable another level besides the colony: the bee yard as a whole.
Instead of having to open five individual curves, bee-pilot could, for example, summarize:
4 out of 5 scale colonies show strong nectar intake.
The average nectar intake of the yard is significantly above the 7-day average today.
One colony significantly deviates from the trend of the other scale colonies.
The beekeeper no longer searches for anomalies in diagrams. The anomaly comes to the beekeeper.
Learning from One Year to the Next
When data is stored long-term, a digital memory of the bee yard gradually emerges.
Then nectar flow start, duration, cumulative weight change, strongest nectar days, nectar flow end, and weather conditions can be compared over years.
The current nectar flow started five days later than last year. However, the weight gain after ten nectar days is higher than the same period last year.
Such information is far more valuable to the beekeeper than simply knowing the current total weight.
Colonies Become Comparable Long-Term
Since the scale in bee-pilot is assigned to a specific colony, weight data can be connected with its history: colony strength, queen and year, inspection results, swarm mood, nectar development, and weight change.
Over several nectar periods, colonies that regularly perform particularly well or particularly poorly under comparable conditions can become visible.
High weight gain alone doesn’t make a good breeding colony. Health, gentleness, swarm tendency, colony development, and other characteristics also matter. The hive scale provides another objective building block.
Does the Beekeeper Actually Have to Do Anything?
This question is at least as important as any warning. Digital systems should not constantly raise alarms.
If the weight loss is normal, the weather explains the development, and the comparison colonies show the same behavior, there should be no warning.
Development normal – no current action needed.
We don’t want to generate as many notifications as possible. We want to generate relevant notifications.
From Hive Scale to Decision Aid
The collaboration between Honeylink and bee-pilot combines two different strengths.
Honeylink provides continuous measurement data directly from the bee colony.
bee-pilot knows the context: weight and trend, daily and multi-day trends, other scale colonies at the site, weather conditions, GTS and phenological development, inspection results, colony strength, swarm mood, queen and colony history, and historical developments of the site.
These pieces of information can be related to each other.
Not just: “How much does my bee colony weigh?” – but: “What is happening at my bee yard, and do I need to react?”
The Technology Observes – The Beekeeper Decides
A hive scale doesn’t see a queen. It recognizes no queen cells. It doesn’t judge a brood pattern. And even the best software cannot always determine the cause of a weight change with absolute certainty.
bee-pilot’s task is different: The system should detect as early as possible what is changing, whether this change is normal, whether it affects just one colony or the entire site, and what other information complements it.
The technology helps direct the beekeeper’s attention more precisely. The decision remains with the beekeeper.
From Measurements to Connections
A modern hive scale produces enormous amounts of data over a season. But the beekeeper doesn’t need thousands of data points. He needs answers.
Is the nectar flow running? Is it getting stronger or weaker? Is the change only weather-related? Is a colony falling behind others? Is the food consumption developing unusually? Are there indications of a special event? Or is everything normal?
This is where the collaboration of Honeylink and bee-pilot comes in.
Honeylink measures. bee-pilot connects. The beekeeper decides.
Thus, a hive scale becomes not just another digital measuring device, but a building block for beekeeping, where data helps understand your own bee colonies better – without trying to replace the beekeeper’s view into the colony.