Varroa Management
Threshold-Based Varroa Management
Measure, Understand, and Act Targetedly
Imagine going to your apiary and asking not:
“When do I need to treat my colonies?”
But instead:
“How heavily is each of my colonies actually infested with Varroa?”
This is the core idea behind threshold-based Varroa management.
Not all colonies develop the same way. While one colony might experience critical Varroa pressure, another at the same site may be far less affected.
Instead of following a strict schedule, measuring, evaluating, and then deciding becomes regular practice.
This sounds simple at first.
In practice, however, especially for beginners, it’s much more challenging.
The Biggest Hurdle for Beginners: What Does My Number Actually Mean?
Beginners in beekeeping quickly face a problem.
For instance, they might count six mites on the debris board.
But what does that mean?
Are six mites a lot? Or a little? Over how many days was this measured? What season is it? Do I need to act now? When should I measure again? And would a different method yield the same value?
Here’s where uncertainty begins.
An experienced beekeeper can often better place a measurement into the context of the season, colony development, location, and past observations.
A beginner lacks this experience.
They must learn:
- which method is appropriate when,
- how to perform it correctly,
- how to calculate the measurement,
- what threshold applies,
- how urgent the situation is,
- and what actions follow.
That’s a lot to know for a single number.
The Basic Principle is Surprisingly Simple
At its core, threshold-based Varroa management involves four steps:
Measure → Evaluate → Decide → Monitor
First, determine the current Varroa load.
Then, place the value in context with the method and timing.
Next, decide if action is needed or if further observation is warranted.
After any action taken, monitor again.
This last point is crucial: Success isn’t shown only by the number of mites falling during treatment. What’s key is how the remaining load develops afterward.
Example 1: The Debris Board
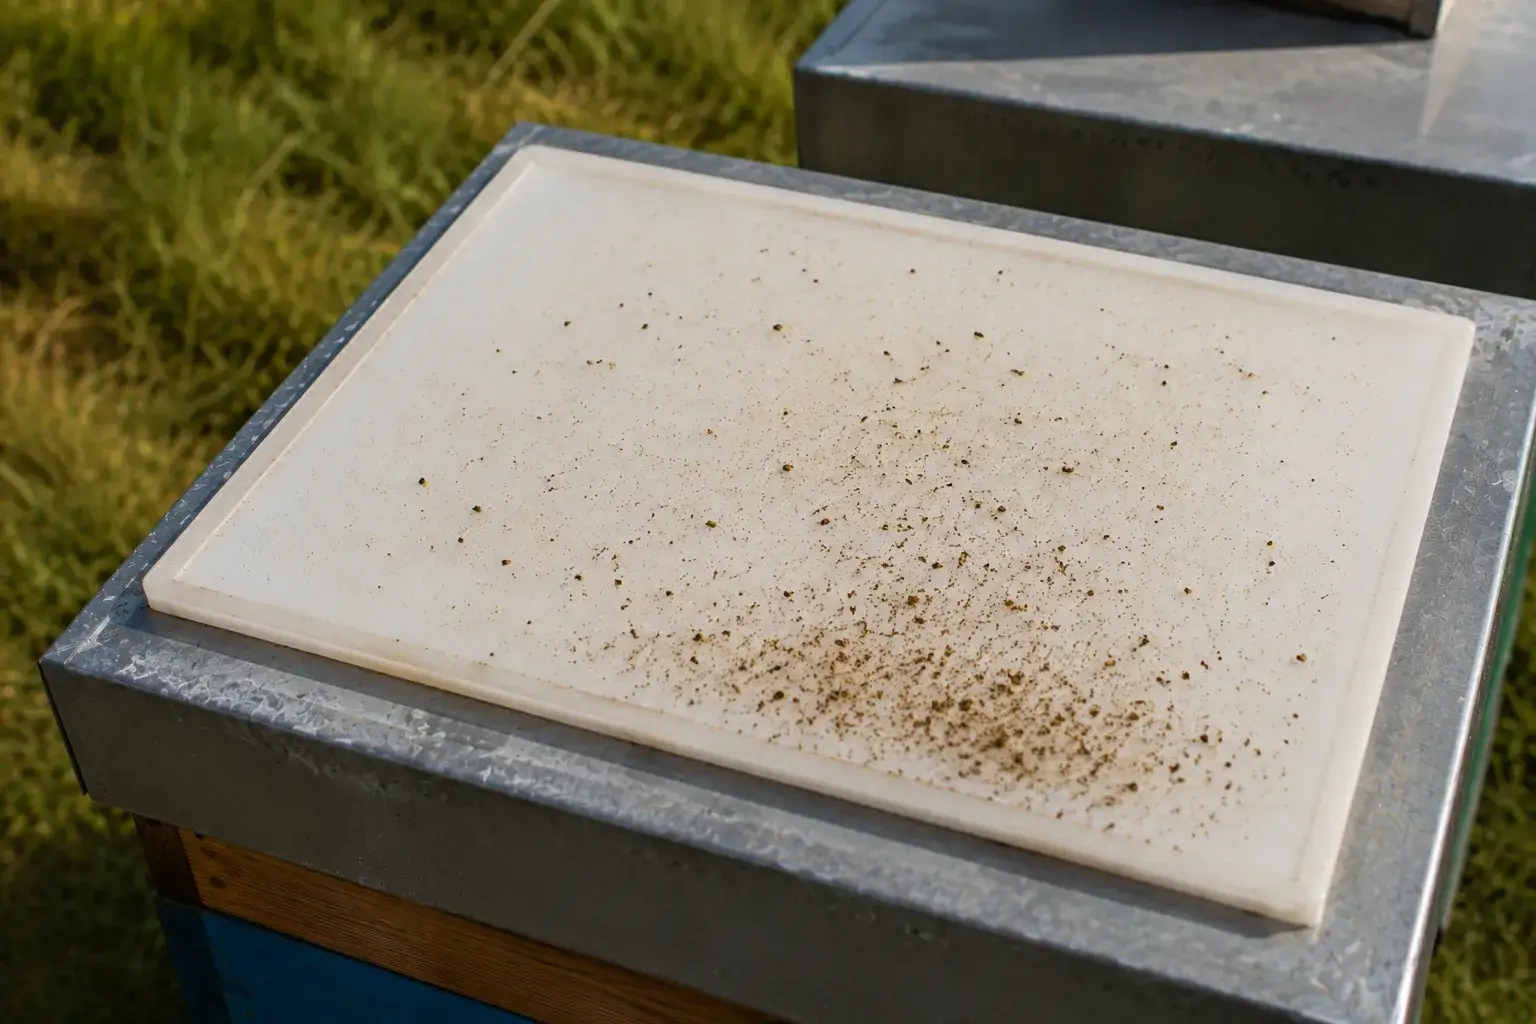
For many beekeepers, debris diagnosis or checking the debris board is an easy entry point.
A bottom insert is placed under the colony for a specific time. Naturally fallen Varroa mites are then counted.
Suppose:
You find a total of 18 mites in three days.
The natural mite fall is:
18 ÷ 3 = 6 mites per day
Now you have a measurement.
But not yet a decision.
That’s because the crucial question is:
What do six mites per day mean at this point in the beekeeping year?
This is why rigid thresholds can be problematic.
The same measurement might be evaluated differently depending on the time of year and situation.
Example 2: Sugar Shake Method
For a sugar shake, a specific number of bees is sampled.
The mites are dislodged from the bees and then counted.
This results in a completely different raw value than with the debris board.
The debris board provides:
Mites per day
A bee sample gives infestation based on the number of bees tested.
Both methods address the same question of Varroa load.
But their numbers aren’t directly comparable.
Example 3: Alcohol Wash Method
In an alcohol wash, a defined bee sample is also examined.
Mites are separated from the bees and counted, determining the infestation of the sampled bees.
This method can provide a good snapshot but differs in execution and the meaning of the raw value from debris diagnosis.
This complexity can quickly overwhelm beginners.
Not Every Measurement Method Speaks the Same Language
As you delve deeper into Varroa diagnostics, the issue becomes clearer.
Different methods exist, such as:
Debris Board Check
→ natural mite fall over a specific time
Sugar Shake Method
→ mite infestation of a specific bee sample
Alcohol Wash Method
→ mite infestation of a specific bee sample
Brood Examination
→ examining the infestation within the brood
Other methods may provide additional information about the colony or for breeding evaluations.
Each method has its justification.
But they each produce their own kind of data.
For an experienced beekeeper, this is already demanding.
For someone with their first five colonies, it can be truly overwhelming.
Then Add the Time of Year
Varroa is not a static problem.
The situation changes significantly over the beekeeping year.
As the bee colony develops, so too does the mite population.
It’s not enough to remember a single threshold and apply it year-round.
The timing of measurement is crucial.
This means for the beekeeper:
A number always needs context.
A Practical Example
Consider two colonies at the same site.
Colony A
Regular checks show a slowly increasing Varroa pressure over time.
Colony B
Under similar conditions, the pressure rises much faster.
For immediate Varroa management, recognizing when action is needed for Colony B is essential.
But the data tells a second story.
Why are these two colonies developing differently?
Answering this question is interesting for breeding.
If such differences appear repeatedly over time, they can indicate which colonies may warrant closer observation and breeding evaluation.
Varroa Management Suddenly Becomes Basic Breeding
This is where threshold-based management becomes particularly exciting.
Those who measure regularly are not just gathering data for the next decision.
They’re documenting how each individual colony develops with Varroa.
This changes the perspective on one’s apiary.
Suddenly, it’s not just about:
“Which colony needs closer attention now?”
But also eventually:
“Why do I have to intervene earlier in this colony than in another?”
Or:
“Why does this colony remain consistently unnoticeable under similar conditions?”
Such observations are particularly interesting for long-term selection.
Here Lies the Path Toward Varroa Resistance
Our long-term goal should not just be to react better to increasing Varroa loads.
We want to promote colonies that cope better with Varroa long-term.
This is also the core idea behind Varroa resistance breeding.
Differences between colonies must first become visible.
And that works only if we measure.
Not once.
But regularly.
Not just the problematic colonies.
But ideally the entire stock.
Only then can we compare.
Supporting Beginners Here
The problem is clear:
We can’t simply tell a new beekeeper:
“Measure your Varroa load and refer to the threshold.”
That’s where the questions start.
- Which method?
- How do I measure correctly?
- What do I need to input?
- How do I calculate the result?
- What does the number mean?
- How should it be interpreted this season?
- When should I check again?
This is where we seek to simplify the thinking process with bee-pilot.io.
The beekeeper conducts the measurement.
The software then helps understand the data.
Turning a Number into Clear Information
Our goal with the Varroa module isn’t to display as many numbers on screen as possible.
Quite the opposite.
The beekeeper should quickly understand:
Where does my colony stand?
Different measurement methods can be recorded with the necessary details.
From the method-specific raw value, a more unified assessment of the load arises.
This load can then be evaluated considering relevant thresholds.
So from:
“I counted 18 mites in three days.”
Comes a much more valuable piece of information for the user:
“How is this colony’s load currently assessed?”
This difference is particularly crucial for beginners.
Yet the Beginner Still Learns
It’s important to us not to take the decision entirely away from the beekeeper.
bee-pilot.io is not a black box that simply says:
Green. Yellow. Red. (5 Levels)
The user should understand over time why their colony is rated as such.
This generates a learning process.
From a beginner who initially doesn’t know what six mites per day mean, emerges with each measurement a beekeeper who better understands their colonies’ development.
The software supports this.
Experience is still gathered at the apiary.
Eventually Experience Becomes Knowledge of One’s Own Stock
After one season, you no longer have just individual notes.
You see trends.
After two or three years, the data becomes even more intriguing.
Which colonies consistently show early signs? Which remain stable longer? Which queens or lines repeatedly demonstrate interesting developments?
These can lead to better breeding decisions over time.
This is our connection between threshold-based Varroa management and Varroa resistance breeding.
One helps us make better decisions today.
The other describes where we want to go long-term.
Conclusion
Threshold-based Varroa management is not just about doing less.
It’s about looking more closely.
Measure → Understand → Decide → Monitor
For experienced beekeepers, it can be an extremely effective tool.
For beginners, however, starting out can be difficult due to the need to understand methods, thresholds, seasons, and decisions simultaneously.
This is exactly where we want to support with bee-pilot.io.
We want to turn measurements into understandable information and ensure valuable observations aren’t lost.
Because the same data that helps assess a colony today can help spot differences across colonies tomorrow.
And these differences are the starting point on the path to more Varroa-resistant bees.
Try bee-pilot.io now