
Overview
What needs attention today is at the top
Keeping twenty colonies in your head works. At eighty it stops working. The cockpit sorts by urgency, not by colony number: the colony with rising mite counts, the apiary not inspected for five weeks, the task due today.
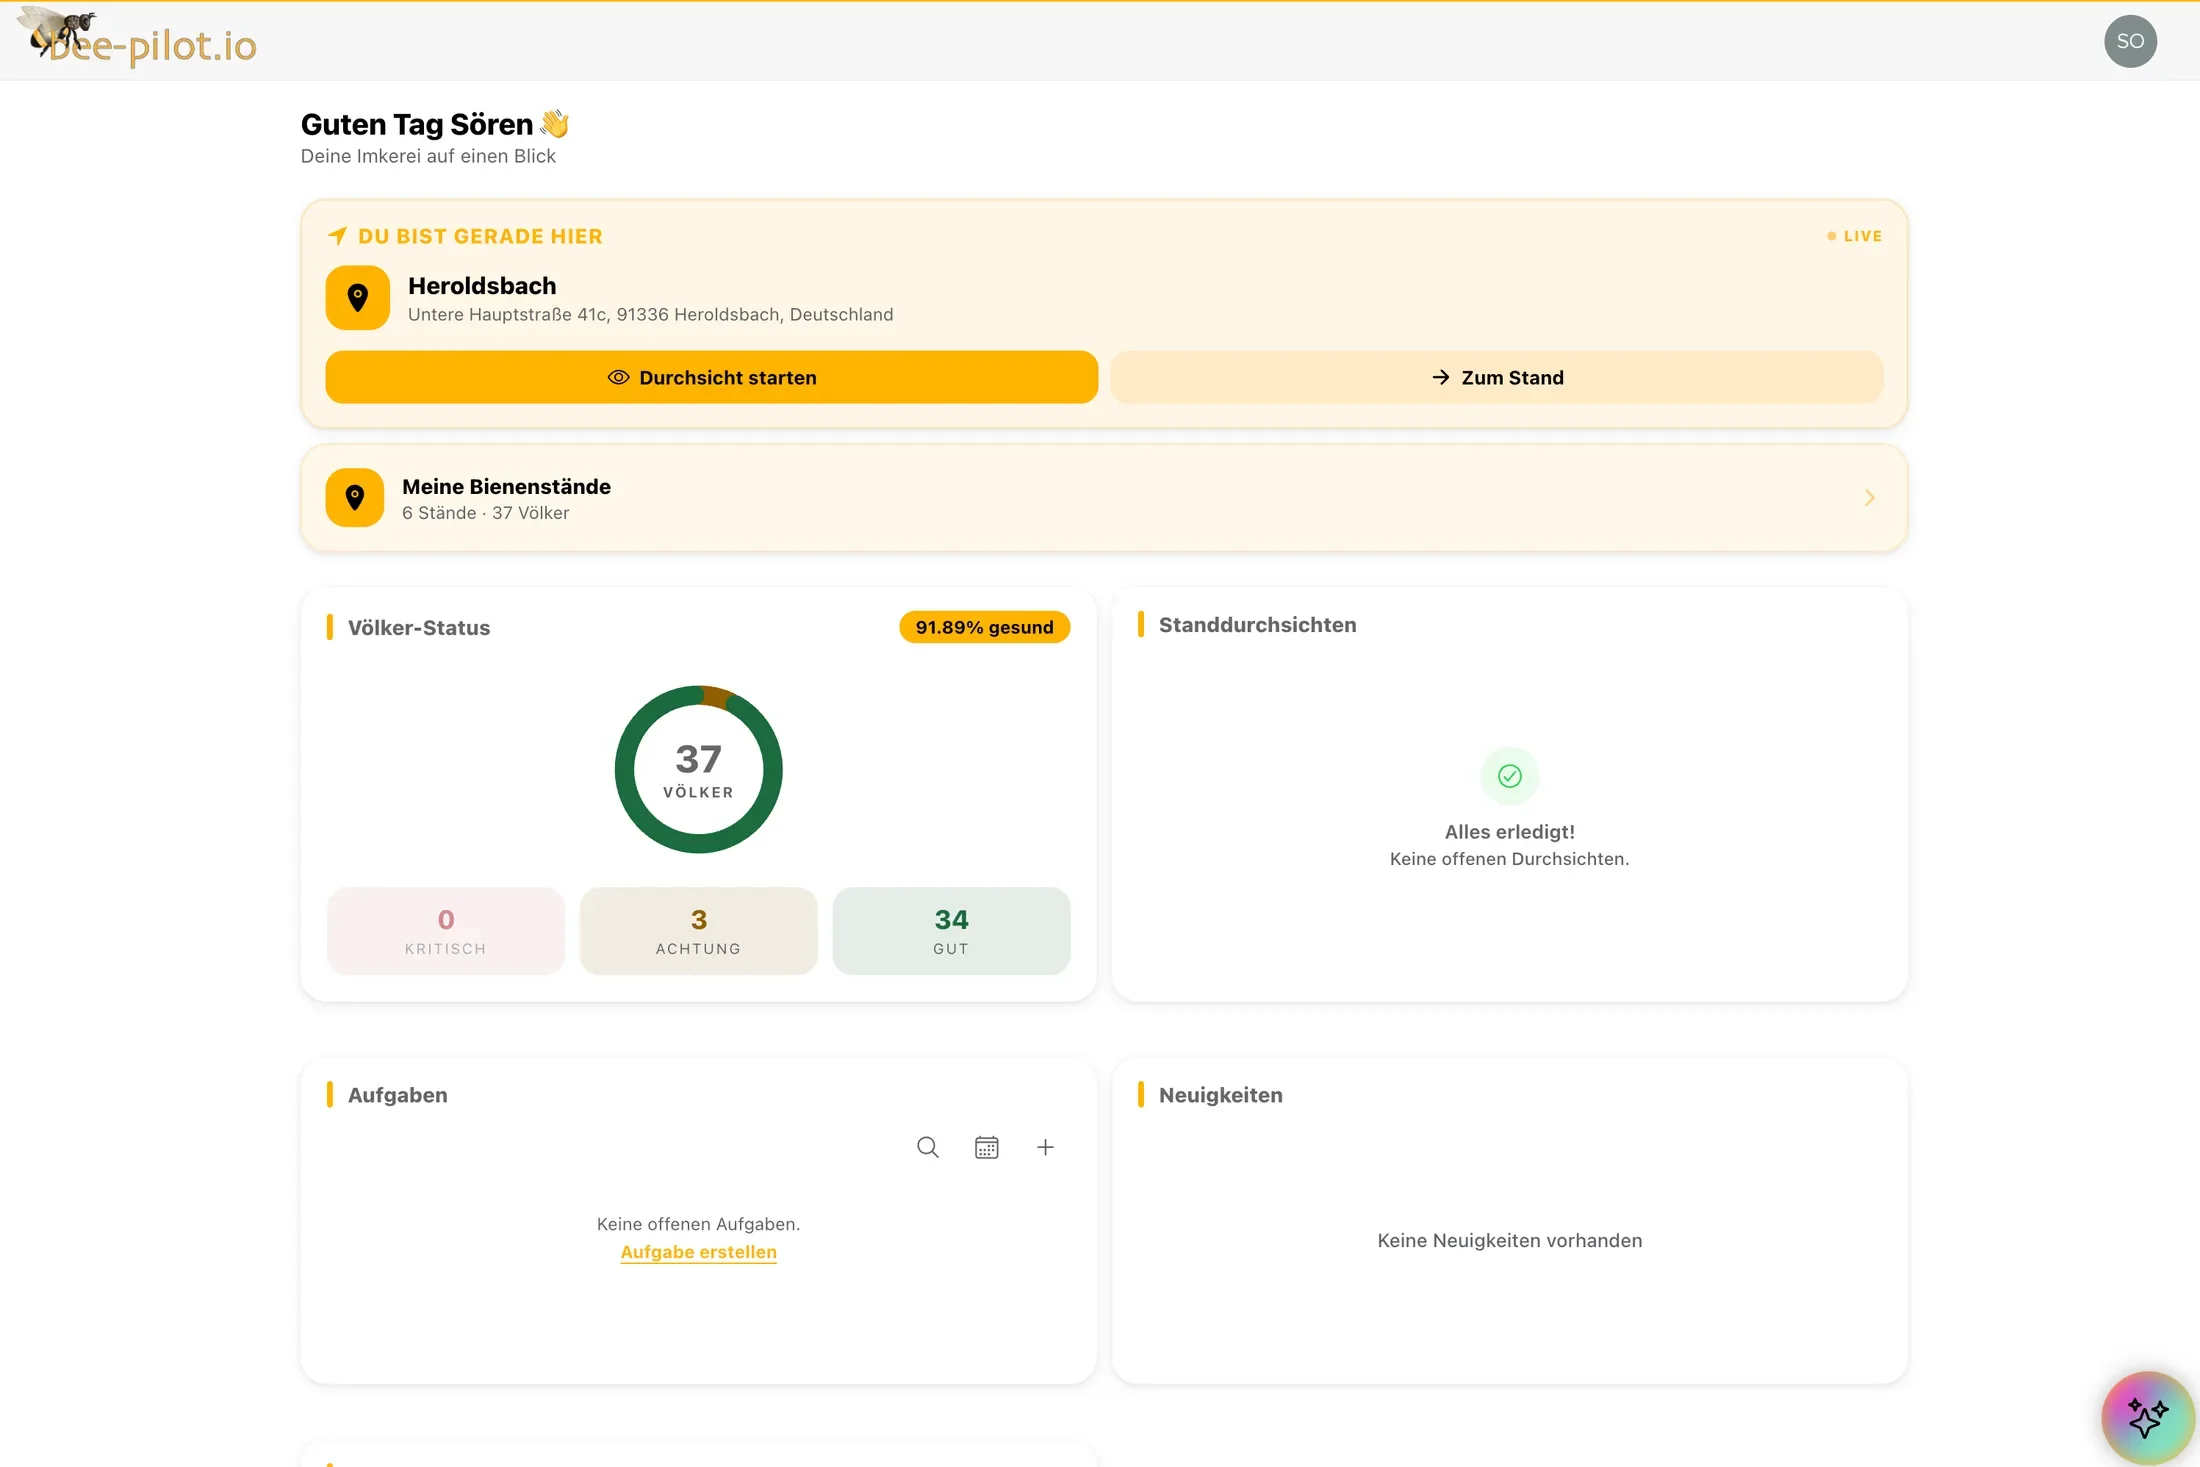
From a number to the colony in one click
Every figure is an entry point, not a display. If it says “three colonies above threshold”, the click takes you to exactly those three — not to a list where you still have to find them.
The trend matters more than the reading
A single mite count says little. The direction says everything. The cockpit shows the curve over recent weeks and highlights where it turns — in time, not in hindsight.
Recorded at the hive, reviewed at the kitchen table
You record outside, with cold fingers and gloves on. You review in the evening, in peace. Both work on the same data — no transcribing, no retyping, no second list.