
Forage
The weather at your apiary, not at the nearest airport
In spring, the difference between the middle of town and the edge of the woods is easily two weeks of vegetation. Every apiary therefore carries its own coordinates and gets its own figures — temperature, rainfall and forecast exactly where the colonies stand.
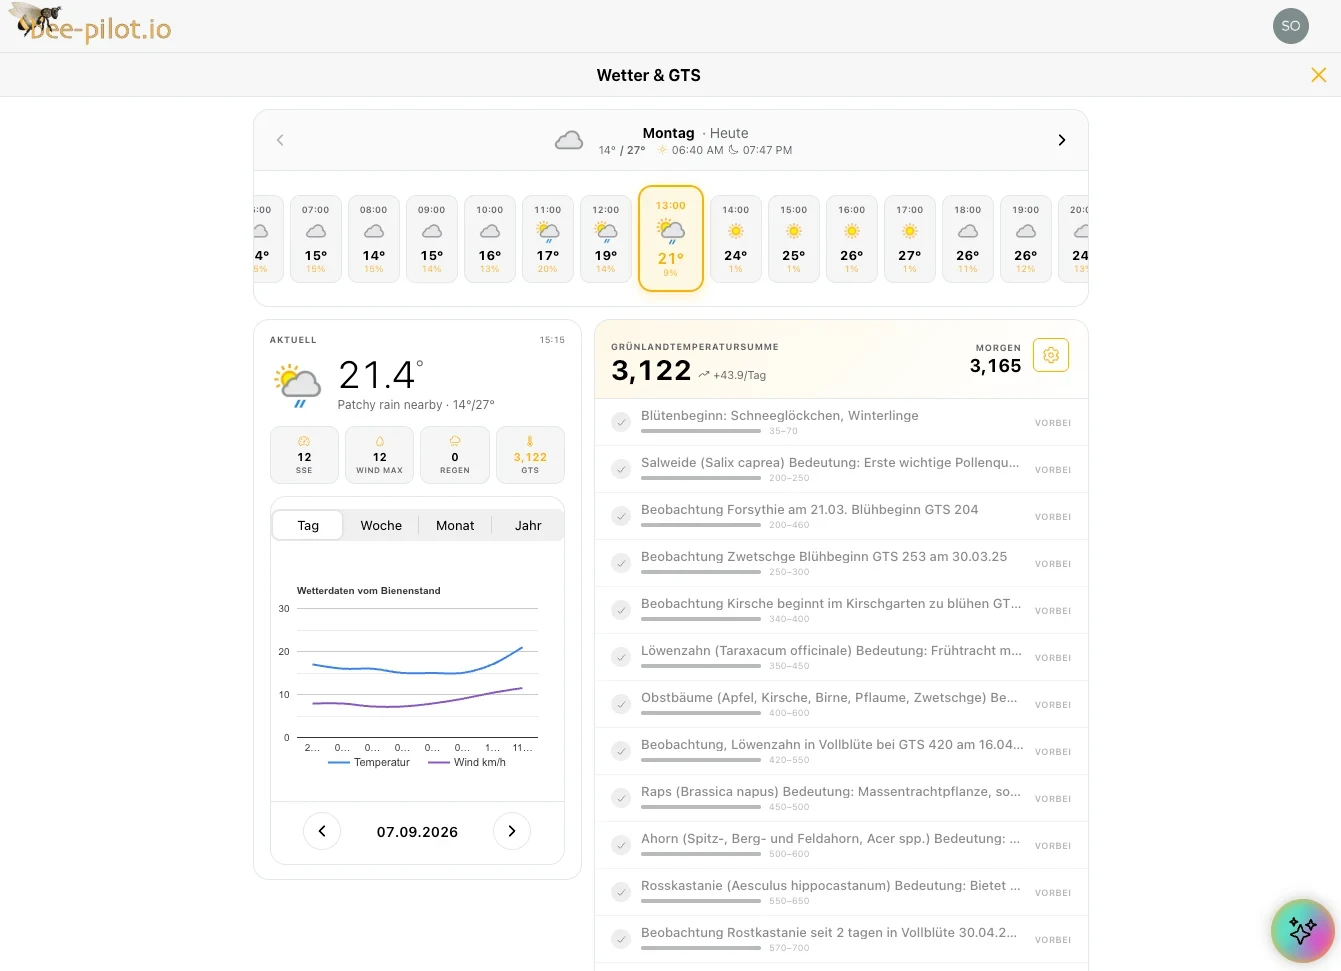
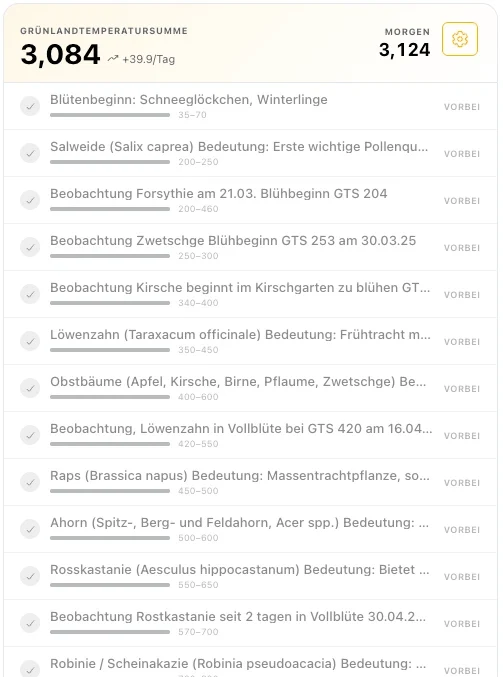
The grassland temperature sum, without doing the arithmetic
The GTS shows how far the vegetation really is — more reliable than any calendar or country saying. bee-pilot.io keeps summing it per location. You see whether the flow is imminent or still two weeks away.
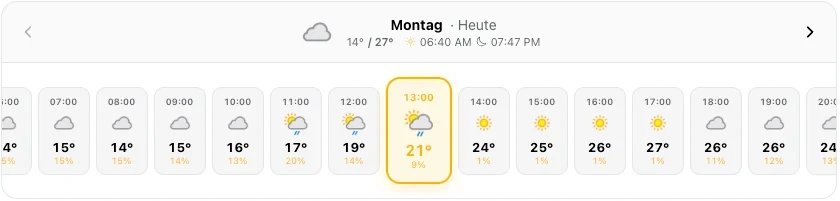
Spot the window before it closes
Adding a super, migrating, inspecting — each has a window of a few days. The forecast at the apiary shows when it opens: not whether it rains tomorrow, but whether the next five days will carry.
Weather next to what you recorded
June’s drop in yield becomes explainable when the week of rain sits beside it. Weather data lives in the same place as your inspections — not in a second app where you have to look up the date.